Cadence Capital’s winning approach
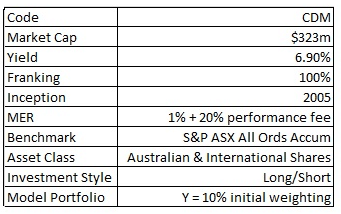
Cadence Capital Limited (CDM) is a listed investment company (LIC) managed by the team at Cadence Asset Management, a privately owned Australian equities manager established by it’s now chief investment officer and one of the three portfolio managers, Karl Siegling, thirteen years ago.
Since CDM’s inception (October 2005) the long short fund, which has recently ventured into international equities to go with its Australian equities, has beaten its benchmark – the All Ordinaries index – by 8.93 per cent per annum. This is a total return of 293.62 per cent (after fees) over the last nine years.
Portfolio construction
The portfolio is typically made up of between thirty to fifty positions wherever those opportunities may lie. The portfolio managers are sector unaware, region unaware and market cap unaware. This also goes for short selling too. This frees up the managers to compile a portfolio, no matter the market conditions here and abroad, of their best ideas.
There are three portfolio managers: Karl Siegling, Chris Garrard and Simon Bonouvrie. Garrard and Siegling have been investing alongside each other for eight years now and Bonouvrie joined the team two years ago. Davies explains, “There is one pool of capital and the three of them all contribute with their best ideas. If they have the same idea it’s whoever gets it in the portfolio first. Each stock enters the portfolio as a 1 per cent position. We add to the positions that do well and cut the ones that don’t do so well. So each manager’s exposure in the portfolio increases or decreases in line with the success of their stocks.”
Explaining the construction further, each stock enters the portfolio as a 1 per cent position no matter the conviction the manager has. Once the stock trend moves materially upward only then are they allowed to add to the position and they will add a further 1 per cent. As the stock continues to move upwards they will continue to add to the position and they are allowed to only add to the position four times after the original purchase and each time is an extra 1 per cent. When asked if their trading method allows them to average down into a falling stock Davies response was clear, “I’d say that’s a fireable offence.”
Once a stock is in the portfolio the team will continue to monitor and adjust for the downside risk. “We do not have a specific price target in mind for our stocks. Our discipline is to let our winners run and cut our losers. One of the biggest risks is you take something off the table and it runs another 10 per cent.” And this explains CDM’s largest position, Macquarie Bank. Macquarie was brought into the portfolio initially as a 1 per cent position. As the price climbed they added to it four more times and have let it run since. It currently makes up 12 per cent of the portfolio.
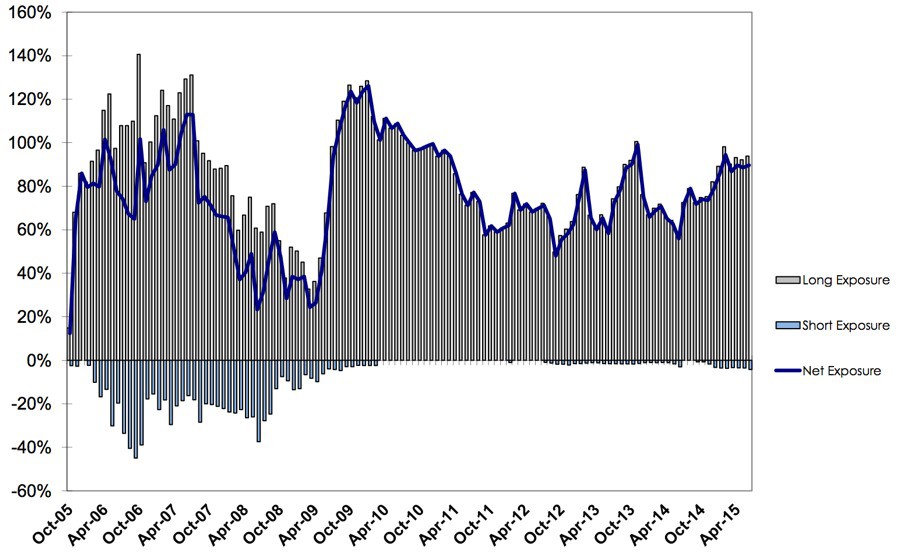
The team apply the exact same approach when it comes to short selling but of course just the other way around. One of the only differences Garrard pointed out was the timing, “you have to be quite aggressive with shorts; you have to add to them quickly. Obviously markets fall quite quicker than they rise.” Another point to note are CDM’s shorts are only put on when they believe the position can provide performance. They are not put on to reduce exposure or as pair trades. Right now the only two short positions in the portfolio are Rio Tinto (RIO) and Fortescue Metals Group (FMG). Historically the portfolio has been predominantly long. RIO is a great example of the flexibility the long/short portfolio brings. Siegling was originally long RIO and Garrard was in favour to have the position as a short. As the technical signs changed the portfolio rules saw Siegling exit his position and Garrard short the stock.
Long short exposure since inception
The team employ a stop loss with their positions as well. They will be hard stopped if the position falls to their predetermined stop loss which is usually around 10-15 per cent. So on a one per cent position they will stand the possibility of losing 10-15 per cent of 1 per cent if the trend goes against them.
The portfolio is also unconstrained in the amount of cash it can hold and has historically averaged a cash holding of 25 per cent. Eighty per cent of the portfolio is made up of the core long/short positions chosen for their strong fundamentals but 20 per cent of the portfolio can be used for what the team call “market participation”. These are trading opportunities around the likes of initial public offerings (IPOs), placements, takeover arbitrage, etc.
I remember being at an investment conference where there were two or three fund managers on a stage being interviewed panel style and Siegling was one of them. He explained his investment method incredibly well and you could see the crowd nodding along as the process resonated with them. It was all straightforward common sense. At the end of the event they put the fund manager’s performance up on the screen.
After the presentation I was chatting with a disgruntled salesman for one of the other fund managers that presented. He said to me he’d been around the country on this road show and it was his company’s idea to put it on. What he didn’t understand was why on earth they invited along a smooth talking, rational thinking fund manager whose fund had more than triple the performance of the fund the salesman was trying to sell. Couldn’t they have chosen someone with performance more in line with their’s? He really was going to earn his commission that week.
Stock selection
When looking for their long positions the team instantly eliminate businesses that do not have a history of profit. This takes the ASX from 2200 companies down to approximately 750. This is a very quick method you could use when searching for stocks yourself as well. The measurement of a company’s profitability is their return on equity. From this they will look for the strongest 35 stocks representing just 1.5 per cent of the market.
To identify these the team are looking for some initial criteria of a (price/earnings to growth) PEG ratio of less than one. A stock with a PE of around 10 growing its earnings by 20 per cent gives you a PEG ratio of 0.5. The PEG ratio is calculated by the PE divided by the growth rate. On top of this they are looking for operating cash flow yield of roughly 12-15 per cent and free cash flow yield of 8-10 per cent with all of this tied in with a strong balance sheet with plenty of cash and low to no debt.
Combine the above initial requirements with multiple company visits and once the stock has ticked all the boxes it will be loaded into the team’s system which will automatically alert the team to their predetermined technical indicators. No matter how good the stock screens on all of their fundamental metrics the system will not allow them to buy the stock if it is a downward trend. Just like the remaining fundamentals Davies and Garrard kept their technical indicators close to their chest as well only mentioning they’ll initiate their first 1 per cent when the
stock is in an uptrend.
One thing I have had to get my head around is the use of technical analysis to time the entry and exit points. Personally my investment background was based purely on fundamentals and if you bought something with conviction and it went down you would buy again because it was cheaper. As a stock ran up you would start to trim it once it exceeded value. One thing I noticed about that approach was you would identify your stock and the price you would be happy to pay for it but perhaps the market was happy to pay a lot less and perhaps the market took a long time to see what you saw in the stock and re-rate it. One thing I’ve taken away from speaking with the team is the benefit of not using fundamentals or technicals on their own but combining them to get an upper hand.
I can understand this investment process might not resonate with everyone – I had to take the blinkers off myself. I would think a number of fundamental stock pickers out there would say if you truly had conviction in a position why not buy it to your full weight or at least half or a third of it. It would be a frustrating to build a position. It’s interesting they let their winners run until the trend turns on them. A part of this is because they mentioned in our meeting one of the biggest potential risks is selling a stock only to have it put on another 10 per cent. But if they only put in 1 per cent in a high conviction call and it re-rates materially aren’t they potentially doing the same but just at the start of the process?
Potentially another way for someone like myself to think about this is to say it is almost like their margin of safety in a way. Putting the 1 per cent in and then waiting for a material re-rating is waiting for the market to put its hand on your shoulder and say, give it a bit more son, you could be on to something. Safety in numbers in a way.
Something to point out is if you agree with technical analysis or not it still doesn’t take away from the fact the investment decisions all start with fundamentally strong (or weak when it comes to short selling) businesses. The rare few that sit in the top two per cent of the market (for the ASX anyway). And another thing you can’t take away from them is the runs on the board. The fact of it is this team have beaten their benchmark by 8.93 per cent pa over 9.8 years.
Fees
CDM is a good example of the new breed of LIC, the one with a fee structure closer to that of a managed fund. In fact this one has a fee structure in line with, if not above, a good number of fund managers. Don’t get caught up by their 415 per cent return figure that is always displayed first. This figure is before fees and including franking. The first rule of marketing is to go for the biggest number. If you look at the returns after fees that number reduces to 293 per cent – quite a significant variance.
Not only has CDM been a good little earner for the shareholders but for Cadence Capital Management too. Let’s remember these newer LICs aren’t run like the likes of BKI and AFIC with miniscule fees and no performance fees. And this is something to keep in mind with all new age LICs. There’s a reason why so many are coming on to the market now with the fee structures and, believe it or not, it’s not just so you can have the pleasure of the potential returns but we’ll save this rant for another time.
If fees are your concern you could have invested in an exchange-traded fund (ETF) over the same period of time and paid a fraction of the fees but also received returns in line with the market. Which would you prefer? I have no problem paying for performance but I would like to see them advertise with the after fees figures first. This is just a small issue I have and in any case they are still light years ahead of the benchmark so there is no need not to include it.
Portfolio size & NTA
Currently there are outstanding options which will be expiring in August. If all of those options are exercised $150m will be added to the portfolio, taking it to $500m. Davies mentioned if it was an Australian equity only fund the maximum capacity to comfortably run the investment strategy without diminishing returns would be around the $250-300m level but with their unconstrained mandate giving them the ability to move offshore the $500m would be an ideal level, giving them a decent level of liquidity for shareholders.
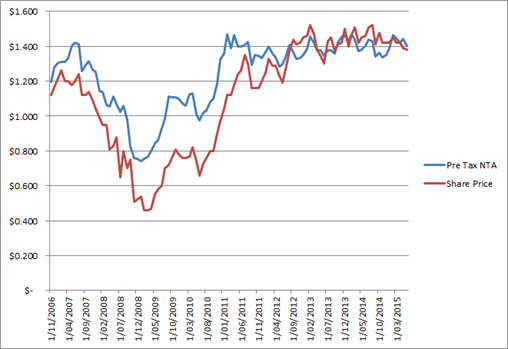
Historically CDM has traded at a fair discount to NTA but in the last few years it has closed that gap with continued good performance and, in my opinion, a greater effort in getting their name out there, with more and more content and information available for investors.
For the last twelve months CDM had been trading at a premium to its NTA to only recently drop back to a discount. When I asked the team they couldn’t make a lot of sense of it. “We don’t know why, it’s just happened. It’s fair to say we’ve never really been able to put our finger on it, discounts and premiums. Some LICs will stay at a premium for years while others will remain at a discount for a long time and then there’s those that go from being at a premium to a discount and vice versa. Right now we are at a 1-2 per cent discount and that is roughly where we want to be. No one wants to be at a big premium, it makes it hard for investors coming in to make money as you need to outperform or continue to.”
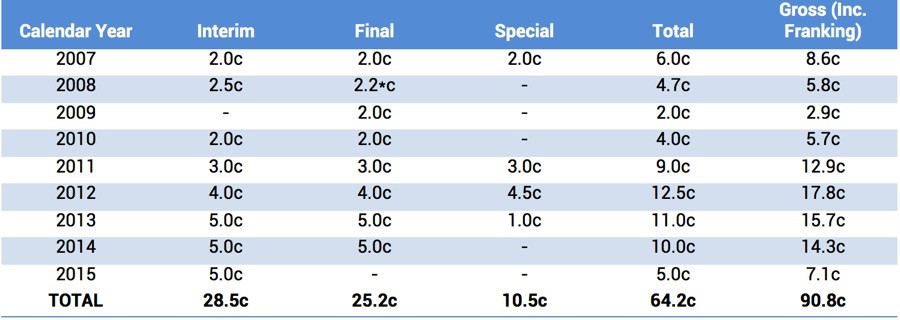
Talking further about their premium/discount to NTA, they mentioned they thought the price should sit at a slight premium due to their substantial franking credits. They reaffirmed the board had committed to paying an increasing stream of fully franked dividends if they are able and as long as they have ample reserves and franking credits going forward. CDM’s current dividend yield is 7.04 per cent.
Once again I like the unconstrained mandate CDM has. I don’t like my managers to have their hands tied and miss out on opportunities which, in the end, means me as a shareholder loses out. CDM is coming into the LIC model portfolio and I will be putting it in as a core holding at an initial weight of 10 per cent. Saying this I will be watching the performance because with higher fees comes higher expectations.
Written by Mitchell Sneddon for Eureka Report


